Does beer affect life expectancy?
Is beer bad for you? A question often discussed in pubs, bars, restaurants, and cafés, but without sobering results.
Data Science to the rescue! There is enormous variation between the average per-capita beer consumption among countries of the world, so let’s see if there is correlation between beer consumption and life expectancy.
Both source of data are simply Wikipiedia tables12
By formatting the data to a simple csv table, it can be loaded into Matlab, and visualised with the following code:
fid=fopen('Desktop/beer consumption and life expectancy.csv')
out=textscan(fid,'%s%f%f','delimiter',',')
beer = out{2}
age = out{3}
scatter(beer,age)
text(beer+dx, age+dy, out{1})
title('Beer consumption vs Life expectancy per Country')
xlabel('liters of beer per capita per year')
ylabel('life expectancy for both genders')
And this is what we get:
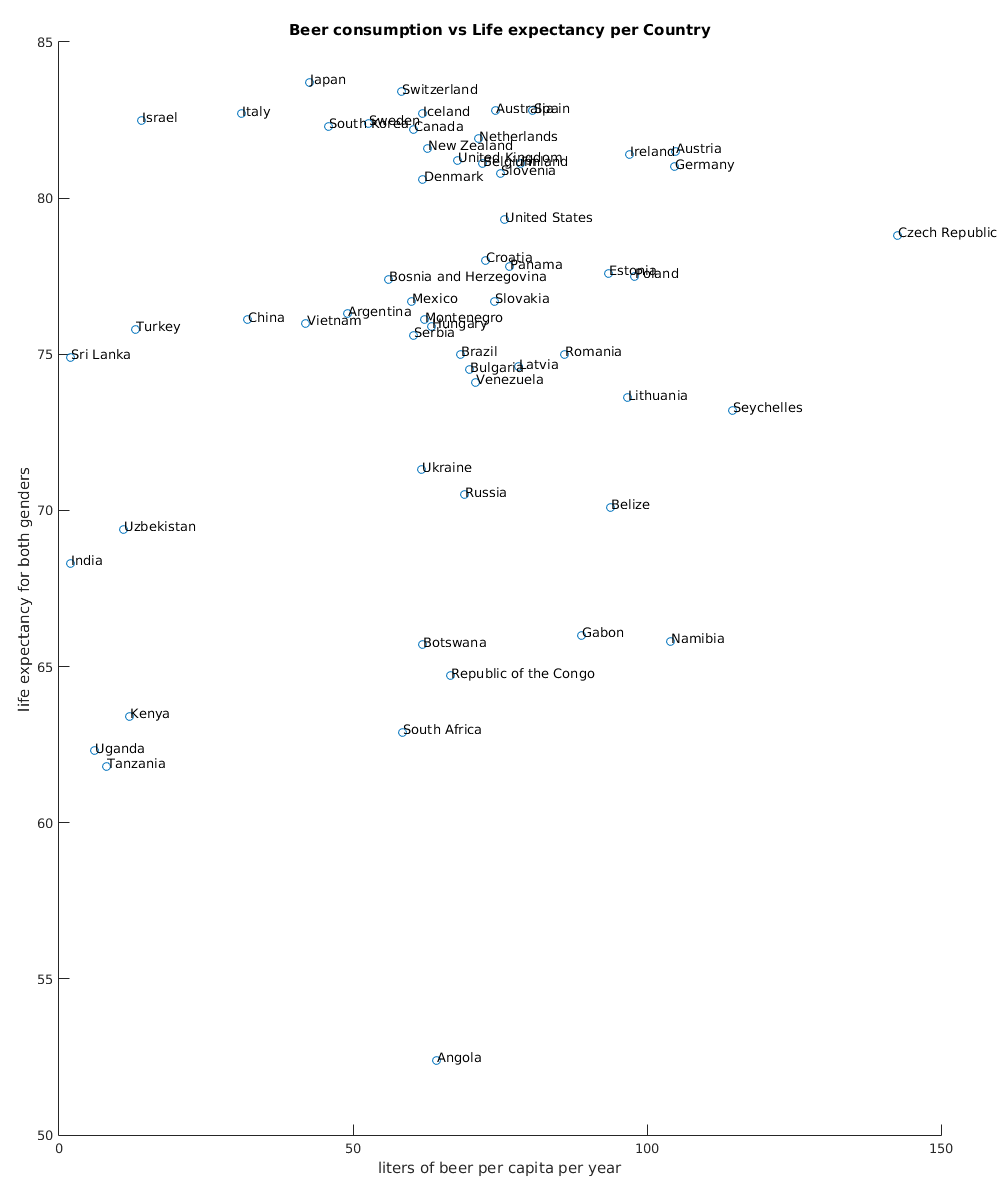
No clear correlation, right? That’s easy to quantify with [p, r]=corrcoef(beer,age). This data gives us a correlation of 0.2129, which means ‘not much correlation’. In fact, the p-value is 0.1086, meaning ‘not significant’.
1: Wikipedia’s list of countries by beer consumption per capita